
CLASS OBJECTIVE
Learn to use the DRAW_BOX() call and practice the loop programming structure, using the graph window in Raptor, by creating given images, using boxes.
INTRODUCTION
Today, you'll learn how to use the draw_box() function and create two different products, the first with some assistance and the second completely alone.
draw_box(x1,y1,x2,y2,color,filled/unfilled)
x1,y1 are the coordinates for the first corner of the box. (left lower corner)
x2,y2 are the coordinates for the opposite corner of the box. (right upper corner)
For example, in a 500x500 graph windows we can use the draw_box Call like this:
draw_box(150,150,350,350,1,1)
and the result should look like:

So far, we’ve been referring to the colors using their names, but you can also refer to them using numbers between 0 and 15. Click here to see the complete list of colors.
- File name: Green Lantern
- Window dimensions: 400x400
- There are 3 circles and 2 boxes so you'll use the DRAW_BOX and DRAW_CIRCLE instuctions. Find out the coordinates by your self.
- You'll need the FLOOD_FILL instruction.

CLASS ACTIVITIES
First activity
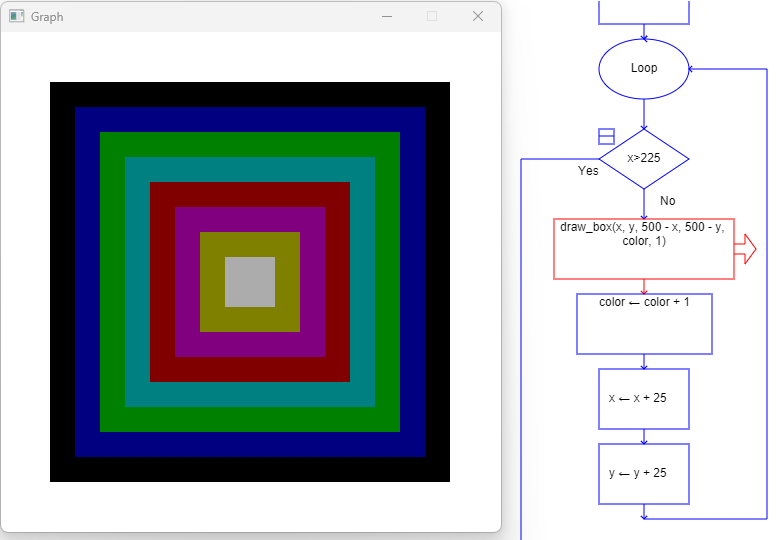
Now, you'll have to create a program, using boxes and loops, to draw an image like the one below.
- In order to get the center of the boxes to be the same (250,250), we’re going to set coordinates (x,y) the same values.
- First we declare variables x and y with a value of 50, this value is going to increase by 25 in each iteration. We are not creating x2 and y2 variables, instead we are going to set x2=500-x and y2=500-y.
- To paint every box with a different color, we need to create a variable named color with an initial value of 0, this value will increase by 1 in each iteration.
Second activity
Now you'll use boxes and loops once again to create the next product, in the graph window, by your self.
Consider that the graphic window is not a square this time so its dimensions are not 500 x 500 anymore.

CLASS NOTES
Write down in your notebook the title of the class, the objective and follow the instructions.
Draw the final flow chart, shown in both Raptor programs.
Explain what every step of the flow chart does, from the start symbol to the end symbol.