CLASS OBJECTIVE
Know the Calls (special functions) in Raptor, to create graphic results such as geometry shapes, by opening a Graph Windows to draw different sizes circles, using loops.
INTRODUCTION
In Raptor we can create graphic results but, in order to do this you must learn how to use the Calls. A Call is a special function, previously programmed, that you can call (which is why the name).
There are plenty of Calls, but today we'll start with a couple of graphic Calls:
- open_graph_window(width, height)
- draw_circle(x_position, y_position, radius, color, filled)
You can compare Calls with the spreadsheet functions. To use them in Raptor you'll insert the Call symbol, then double click on it and you'll have to type the Call and its parameters.
For example, to open a graph window you would type:
- open_graph_window(300,500)
- where 300 represent the window width
- and 500 represen the window height
Once you open a graph window, now you can draw on it, for example a circle:
- draw_circle(150,250,80,red,0)
- 150,250 represent the position of the circle´s center
- 80 is the radius lenght
- red is obviouly the color
- 0 will be use to draw an unfilled circle and 1 to draw a filled circle.
ACTIVITY PART 1
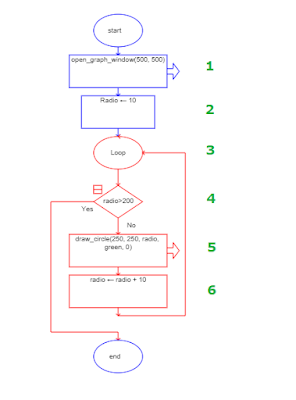
Create the next Raptor program and try it. Use the name Student number + graph window for the file.
- Change the window size.
- Change the color using english.
- Change the circle´s center.
- As you can see, the circle´s size depends on the user selection.
CLASS NOTES
Write down in your notebook the title of the class, the objective and follow the instructions.
- Draw the last flowchart in your notebook, the one with the Loop.
- Describe, in your own words, what is the algorithm doing in every step indicated (numbers 1 to 6)
- OPEN GRAPH WINDOW
- DRAW CIRCLE
- DRAW LINE
- DRAW BOX
- FLOOD FILL


