December 07, 2024

Week 17-18 - Lines and coordinates practice

 CLASS OBJECTIVE

Practice the loop and  draw_line call using the graph window in Raptor, by creating a given image, using lines and loops.


INTRODUCTION

Today, you'll create two different products, the first with some assistance and the second completely alone.

In the first program you'll have to use a new Call:      

draw_line(x1,y1,x2,y2,color)

  • x1,y1 are the coordinates for the starting point of the line
  • x2,y2  are the coordinate for the ending point of the line

For example, in a 500x500 graph windows we can use the draw_line Call like this:
draw_line(100,50,450,350,blue)
and the result should look like:


INSTRUCTIONS

First program
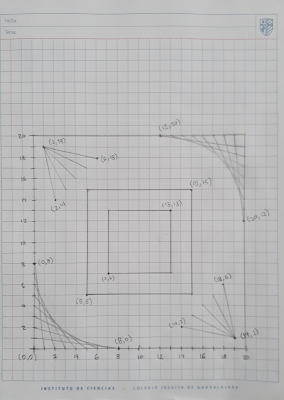
Now, you'll have to create a program, using lines and loops, to draw a grid like the one in the image.
To draw the vertical lines you have to increase the X value, by 10.
To draw the horizontal lines, you have to increase the Y value, by 10.


Second progam
After you create the grid, now you'll use lines and loops once again to create the next product in the graph window.
Obvioulsy you'll need two variables because while the X value increases, the Y value decreases.


CLASS NOTES

Write down in your notebook the title of the class, the objective and follow the instructions.

  • Draw the final flow charts, shown in both Raptor programs.
  • Explain the loops structures and the draw_line coordinates.

December 02, 2024

Week 15 - Loop and graph window practice in Raptor

 CLASS OBJETIVE

Practice the loop programming structure using the graph window in Raptor, by creating a given image, using circles and loops.


ACTIVITY INSTRUCTIONS

As you've heard, the idea is that you con create your own programs to solve problems with out your teacher's help. Today, you'll have to create a program with a minimum of instructions. You'll use the graph window Calls, besides a loop, but you'll have to use previous knowledge to do it. 

Create the new program in Raptor and name it  Student number + Shield. Use the next image to know the final outcome.
  1. The graph window size must be exactly 500 horizontal and 500 vertical pixels.
  2. This is sequential program but you can try to use a loop to create the circles.
    • You'll need to use a variable to set the radius of the first circle to 250 pixels. Each subsequent circle should be 50 pixels smaller, continuing until the end.
    • Draw filled circles from outside in, alternating between light red and white.
  3. After the circles, draw the 5 lines using the next coordinates
    • (250,350)
    • (345,285)
    • (310,170)
    • (190,170)
    • (155,285)
  4. Use flood_fill to color blue. You'll have to find out the needed coordinates.

Once you finish the algorithm, turn it in using the Classroom post.


CLASS NOTES

Write down in your notebook the title of the class, the objective and follow the instructions.

  • Draw the final flow chart, shown in Raptor
  • Explain what does every step of the flow chart do, from the start symbol to the end symbol.

November 25, 2024

Week 14 - Lines and flood filling

 CLASS OBJECTIVE

Create a given figure in the graph window by using the Draw_line and the Flood_fill calls, to ensure the understanding of coordinates in the Cartesian plane


INTRODUCTION

It seemed necessary to teach you how to create lines in the graph window and how to fill closed areas with color, like in Paint, before we combine them with loops. Take a look at the next Raptor calls.

draw_line(x1,y1,x2,y2,color)

  • x1,y1 are the coordinates for the starting point of the line
  • x2,y2  are the coordinate for the ending point of the line

For example, in a 500x500 graph windows we can use the draw_line Call like this:

draw_line(100,50,450,350,blue)

and the result should look like:


flood_fill(x1,y1,color)

  • x1,y1 are the coordinates to flood fill the closed areas.
  • Color: Here you have the color list you can use: Black, Blue, Green, Cyan, Red, Magenta, Brown, Light_Gray, Dark_Gray, Light_Blue, Light_Green, Light_Cyan, Light_Red, Light_Magenta, Yellow, White

I'm sure you'll get the point in the next activity


ACTIVITY

You'll star the activity in a grid sheet of paper. 

  • Draw a box of 10 by 10 squares
  • Every square represent 50 pixels
  • As always, the starting point is the left lower corner.
  • Now, try to determine the coordinates for every point in the next figure.
    • Write down every coordinate either in the plane or beside it.


Now, you will create a program in Raptor to create this figure, using the coordinate you obtained in your grid sheet of paper.
  • Don't forget to use the flood_fill call to apply colors. You'll have to determine a point inside the closed areas using coordinates.
  • Once you finish, turn in the outcome file using the Classroom post.


CLASS NOTES

Write down in your notebook the title of the class, the objective and follow the instructions.

  • Explain the draw_line and the flood fill calls, and their parameters

November 17, 2024

Week 13 - Calls, special functions in Raptor

 CLASS OBJECTIVE

Know the Calls (special functions) in Raptor, to create graphic results such as geometry shapes, by opening a Graph Windows to draw different sizes circles, using loops.


INTRODUCTION

In Raptor we can create graphic results but, in order to do this you must learn how to use the Calls. A Call is a special function, previously programmed, that you can call (which is why the name).

There are plenty of Calls, but today we'll start with a couple of graphic Calls: 

  •  open_graph_window(width, height)
  • draw_circle(x_position, y_position, radius, color, filled)

You can compare Calls with the spreadsheet functions. To use them in Raptor you'll insert the Call symbol, then double click on it and you'll have to type the Call and its parameters.


For example, to open a graph window you would type:  

  • open_graph_window(300,500)
    • where 300 represent the window width 
    • and 500 represen the window height

Once you open a graph window, now you can draw on it, for example a circle:

  • draw_circle(150,250,80,red,0)
    • 150,250 represent the position of the circle´s center
    • 80 is the radius lenght
    • red is obviouly the color
    • 0 will be use to draw an unfilled circle and 1 to draw a filled circle.


ACTIVITY PART 1

Create the next Raptor program and try it.  Use the name Student number + graph window for the file.

  • Change the window size.
  • Change the color using english.
  • Change the circle´s center.
  • As you can see, the circle´s size depends on the user selection. 

Show your teacher the program and continue with the second part.


ACTIVITY PART 2
Now you'll change (or restart) the program to draw many circles usin a loop, as we learn in the last class. Use the next image to do it.

Once you finish, turn in the file using the Classroom post and continue with the class notes.


CLASS NOTES

Write down in your notebook the title of the class, the objective and follow the instructions.

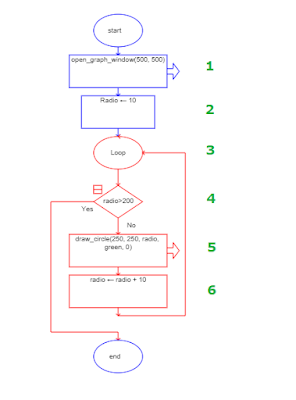
  • Draw the last flowchart in your notebook, the one with the Loop. 
  • Describe, in your own words, what is the algorithm doing in every step indicated (numbers 1 to 6)


HOMEWORK

Research, using the Raptor official page (https://raptor.martincarlisle.com/docs/), the next graph drawing operations and tell, in your own words, how do they operate.
  1. OPEN GRAPH WINDOW
  2. DRAW CIRCLE
  3. DRAW LINE
  4. DRAW BOX
  5. FLOOD FILL

November 15, 2024

Week 12 - 2nd Period Cover design

CLASS OBJECTIVE

Kown the Raptor Graphic Window structure by drawing lines and boxes in a Cartesian plane, in the 2nd Period cover.


ACTIVITY

As always, you'll have to create your notebook cover, but this time you're going to use a Cartesian Plane to draw some lines and boxes. This will help you understand our next topic, the Raptor Graphic Window in which we'll use X and Y dimensions (coordinates).

Besides, don't forget to include the next elements. You can use the upper section of your cover.

  • Your full name, list number and group
  • PERIOD 2, in big size letters
  • RAPTOR GRAPHIC WINDOW, also big size letters

Turn the page and, behind the cover, write down the Evaluation Criteria

  • Class Activities  45%
  • Homeworks  15%
  • Attitude   10%
  • Summative Evaluation   30%


Week 11 - Summative Assessment

 CLASS OBJECTIVE

Evaluate the knowledge and skill abilities developed, in this first Period, in the basic use of Raptor Programming Environment

October 29, 2024

Week 10 - Loops and selections practice

CLASS OBJECTIVE

Review the three programming structures and the Raptor symbols you learned in this Period 1 by creating a simple game.


ACTIVITY 

It's very simple, you're going to create the next algorithm in Raptor. Name de file as DICE ROLL and you won't receive any other help, you must review what you learned. 

To zoom in the image right click on it and open it on a new tab.

After you finish the algorithm, test it and save it properly but before you turn it in you'll insert COMMENTS to explain every symbol purpose. To do so you must right click on a symbol.


Don't forget, you must right click on every symbol to explain what does it do, as clear as possible.

  • Deliver your file on the Classroom post.


CLASS NOTES GRADING

While you work, I'll review and grade your class notes in your notebook.

October 21, 2024

Week 9 - Loops in Raptor

CLASS OBJECTIVE

Learn the third programming structure named Loop, to create repetitive procedures, using Raptor to create lists of numeric series.


INTRODUCTION

You've learned that when creating an algorithm, the program can execute all the instructions one by one until the end. We called this sequential coding.

Then, you learned to use decisions to create differents paths of coding, which means that not all the steps of the program will be executed. This decision are represented by the rhombus figure.

In this class, you'll learn to create repetitive procedures, in other words, coding that is executed as many times as needed. This kind of programming is called Loop.

Obviously, in Raptor you can drag the loop symbol from the left panel and place it in the algorithm.


In the example, there's a variable named contador which initially contains the number 1. When the algorithm enters the loop, contador will be shown, then it'll increse by two using an assignment symbol. This means that contador no longer contains the number 1, now contains the number 3.

In the next step, the program decides to exit the loop if the condition is matched, en the example contador must be larger than 50 to exit the loop. If not, the program returns to the beginning of the loop.


ACTIVITY

Today you'll create a Raptor algorithm using two loops and a decision. The name of the file will be Student number + Loops and decisions

The main idea is to show the odd numbers between 1 and 50 or to show the pairs numbers between 2 and 50, the user will decide.

  • When the program starts, it should ask the user to decide between odd or pairs. Use an Input Symbol and a Rhombus to create two paths.
  • To use Loops you'll need a variable that changes its content in every cycle. In this activity that variable will be known as counter. This counter will increse by two every cycle.
  • In every cycle, the algorithm shows the user the counter (variable) using a raptor output symbol.
  • When the variable (counter) meets the established condition, the procedure will exit the loop and end the program.


  • As always, when finished, turn in the file using the Classroom post.


CLASS NOTES

Write down in your notebook the title of the class, the objective and follow the instructions.

  • Explain, using your own words, the repetitive coding(loops) and compair it to sequencial and decision coding.
  • Imagine an every day problem that could be solve using loops coding.


HOMEWORK
Research using Internet and write down in your notebook:
  • What is a Call in Raptor and how do we use it,?

October 15, 2024

Week 8 - Selections (Reinforcement Activity)

CLASS OBJECTIVE

Create a Raptor algorithm by your own, using selections, assignments, inputs and outputs, to design a Cash Register.


REINFORCEMENT ACTIVITY

You will create a program in Raptor, but this time you will only have a minimum stock of instructions.

This program will help you reinforce an important topic: you'll create a Cash Register  using selections/decisions.

  1. Open Raptor and save the  file (still empty) with the name  Cash Register with selections
  2. The program must ask the user for a product price and a discount (options 0%, 15%, 30% )
  3. After that, the program will follow the selected path to calculate and show the final price.
Use the next image as a base but you must deduce the  configuration for every symbol


Obviously you'll have to turn in using  the Classroom post.


CLASS NOTES

As always, write down in your notebook the title of the class, the objective and follow the instructions.

  • Draw the final flowchart with all the instructions.

September 28, 2024

Week 6 and 7 - Selections/decisions in Raptor programming

CLASS OBJECTIVE

Create an algorithm to decide between three different formulas, by using the decision symbol in Raptor, to calculate areas from a rectangle, circle or triangle.


INTRODUCTION

In the last course you learned to use the IF() function in a spreadsheet. It helped you to create programs in which users could make decisions, for example, between answers or products, etc. Now you'll program Raptor algorithms to make decisions, to select between different options.


DECISIONS

Just like in the last class, you just have to drag the decision (selection) symbol from the left panel to the flowchart. It is very important to place it where a decision has to be made, after you have saved information in a variable.

Once you've inserted the symbol you can double click on it to configure the decision. A decision is a compairson operation like in spreadsheets. For example, N1=10, lastname="GonzƔlez", etc.

In the examples, N1 or lastname are declared variables, this means that you used them and saved information in it before you make the decision.

Here's another example.


As always, it'll be easier to understand by developing a couple of programs.


ACTIVITY

Today's program will calculate areas of common shapes: rectangle, circle or triangle. Open Raptor and start saving the file. Name it Areas of common shapes. 

Obviously, you'll have to use decisions, Selections symbols, to create different paths in the code.

From this point on it's important that you receive less instructions, so look at the flowchart and try to solve the problem.

  • Use an input to ask for the shape: (1) for triangle, (2) for rectangle, (3) for circle. The variable will be named Shape.
    • Remember to double click on every symbol to set the configurations. For example, to get the decision about the shape or to get the shapes dimensions ,you need inputs, and every input need a variable to save the data.
  • Use the selection symbol, as shown, to create the four paths. Ask for the variable Shape to decide the path.
  • Each path should ask for the data of the selected shape, for example: triangle need the base and the height to calculate the area.
  • If the user don't select a correct option, then a message should be shown.


Test the program and if it works send it to your teacher through Classroom.


CLASS NOTES

As always, write down in your notebook the title of the class, the objective and follow the instructions.

  • In your own words, What is the difference between sequential programming (last class) and decisions/selections programming?  (Use at least 60 words)
  • Now explain the Rhombus symbol (Diamond): What does it do? What does it need to work properly?


September 21, 2024

Week 5 - Sequential coding in Raptor

CLASS OBJECTIVE

Recognize that when programming there are different techniques to write code, and the first is the sequential coding, which means that the code executes step by step from the start to the end, without alternate paths.


INTRODUCTION

Now you know how Raptor works: through the creation of flowcharts. Last class, Two new symbols were introduced to you, the input to collect information and the output to show the results.

Besides, there was another important concept that we have to reinforce: variables.


VARIABLE is a memory space reserved to save information. Before you start any process you have to declare variables, which means give them name and type. In the Raptor case you just have to name the memory space in an input or assignment.

perimeter ── 3.1416*radius

In the example, there are two variables, radius that already has information saved in it, and perimeter which is a new space of memory that will receive the result of the multiplication.


Variable names can't have special characters, such as @ *  #. The suggestion is to use lowercase letters and/or numbers, in this order, without spaces.

Tip: you can compare variables with cells in a spreadsheet. You can type information in them to save it, and any cell has its own name.


ACTIVITY

You'll create a program to calculate your first period average. Open raptor and start saving the file. Name it Average Calculator and your student number, example: Average Calculator 12345

  • Insert 12 Input symbols, one for each subject.
  • Configure each one of them to ask for the final subject score, and name the variable as the subject. Example, ask for "EspaƱol" final grading and save it in a variable named espaƱol.


  • Now, insert an assignment symbol after the input boxes. 
  • Configure it to add the 12 gradings and divide the result into 12. Assign the final average to a variable named periodaverage. As you can see, there is no space between the words.


  • For the last, insert an output symbol. Configure it to show the periodaverage variable.
  • Test the program and if it works send it to your teacher through Classroom.

 As you can see, this program executes every step, one by one, until the end. This is called sequential coding.

Next class we'll use the rhombus symbol once again to decide between different paths, by making decisions.


CLASS NOTES

As always, write down in your notebook the title of the class, the objective and follow the instructions.

  • What does "sequential coding" mean?
  • What is a variable?
  • Variable names must avoid special characters, Name at least 5 of these special characters.
  • Draw a flowchart, such as in the activity, to calculate the course average, asking for the three period averages.


HOMEWORK
You will do an investigation about Algorithms and Programs. Write down the next questions and anwer them in your notebook, using your own words.
  • What is the meanning of Algorithm?
  • What is the difference between Algorithm and Program?
  • Describe in your own words an algorithm to solve a home problem.

September 17, 2024

Week 4 - Raptor programming environment

CLASS OBJECTIVE

Know the Raptor programming environment for the first time, by creating a program that performs a basic process to request information, do a process and displays a result.


FLOWCHARTS

Last class you learned to use 3 flowchart symbols: the elipse (oval), the arrow and the rectangle. Now you'll learn to represent interaction with users though the paralelogram that may represent input and output.
Before start programming 


  • Process or assignment, which represent the internal processes like calculations or the manipulation of the information.
  • Input ask a person to introduce information, for example, words or numbers.
  • Output does exactly the opposite, it shows information to the user, mostly the results of the processes. 

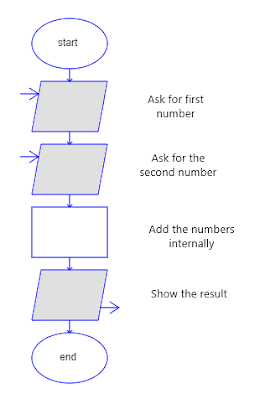
Let's try one last paper flowchart using the Input and Output symbols.


RAPTOR

Before we start with Raptor you have to install the Direct access icon. Follow the next directions:

  1. Open the Window´s File Explorer and the "Este equipo" option on the left panel.
  2. Double click on the Hard Disk Drive (Usually C:)
  3. Now look for the "Archivos de programa (x86)" folder and get into it.
  4. Look for the "Raptor_avalonia" folder and get into it.
  5. Locate 


INTRODUCTION

You've been learning to create problem solutions using technology tools. Now you'll be introduce to programming languages with Raptor programming environment.

With Raptor you´ll create programs (algorithms) and when you execute them you'll see the process step by step.

The Raptor main feature is that the programs will be created using flowcharts. 


When you open Raptor you'll alway see the ellipse figures that start and end the program. Between them you'll have to place the flowchart elements that will be executed. 


FIRST PROGRAM
Obviously  you'll have to open Raptor. It should be installed in your Windows desktop. Its icon shows a dinosaur.
Once opened, Raptor will show you 2 windows, the main programming window and the master console. You'll design in the main window but you'll see the results of your algorithm in the master console. (You can look at the image up above)

To start you just have to drag the symbols (input, output and assignment) to the space between the start and end ellipse.
  • Drag the Input symbol to the main structure 
    • Double clic on the input symbol. 
    • "Prompt" is the text that will be shown to the user. Type "What is your name?"
    • "Variable" is the name that will be assign to information collected. Type NAME
  • Drag the Assignment symbol to the structure
    • This is the process that will be executed. Double clic on it.
    • Type SALUTE in the SET text box. 
    • Then type "WELCOME "+NAME+" TO RAPTOR"
  • Drag the Output symbol to the structure
    • Double clic on it.
    • Type "SALUTE"
    • This will be the answer that will be shown in the console window.
To execute the algorithm press the play button. Before, I suggest to slow the execution so you can see it step by step.

To save the algorithm click on the FILE menu, select SAVE and type a name for the file.


ACTIVITY

Instead of typing messages, you´ll create a small calculator. Clic on FILE menu and NEW to create a new algorithm.

  • Use 2 input symbols to ask for two numbers. 
    • Name them N1 and N2
  • Use 4 assignment symbols to Add, Subtract, Multiply and Divide. 
    • Name them ADDITION, SUBTRACTION, MULTIPLICATION and DIVISION
  • Use 4 output symbols to show the results. 
Name the file as CALCULATOR.rap
You'll deliver this file through a Classroom post.


CLASS NOTES

As always, write down in your notebook the title of the class, the objective and follow the instructions.

  • Explain in your own words, What is Raptor?
  • What does "programming environment" means? You can use Google.
  • Draw the Raptor symbols that we used in today activities.


September 07, 2024

Week 3 - Introduction to Flowcharts

 CLASS OBJECTIVE

Recognize the use of symbols to represent a process when working with flowcharts, and identify the first three basic symbols: start/end, arrow, and process.


Common Symbols

A symbol is usually a drawing with a meaning that many can easily understand. For example, can you tell the meaning of every symbol on the next image?


Probably most of you were able to identify the meaning of all the symbols above since they each have one meaning or represent a single action or tool. But what happens when you want to represent a set of steps or a process? Well, there is a graphic resource that allows us to represent a process using mainly symbols, and it is called a flowchart.


HOMEWORK INFORMATION RECOVERY

Let's all discuss about your homework results, in plenary:

  • What is a flowchart?
  • What are the different symbols in a flowchart and their meaning?
  • What are flowcharts commonly used for?
  • Draw an example of a flowchart and explain it.


Helpful references

What is a programming flowchart?

A programming flowchart is a visualization tool programmers use when creating new applications to understand a process, workflow or algorithm. It typically uses geometric shapes to represent steps and arrows to communicate the flow of data.

Indeed Editorial Team(September 28, 2023),What Is a Programming Flowchart?,https://www.indeed.com/career-advice/career-development


Flowcharts

A flowchart is a diagram that represents an algorithm. It is read from top to bottom and uses shapes and arrows to show what happens in a program. You and your team can use flowcharts to help plan out how to create your code and organize your code.

2024 Technovation, Flowcharts, https://technovationchallenge.org/


FIRST STEPS INTO FLOWCHARTS: ARROWSTART/END AND PROCESS SYMBOLS

Algorithm

Most of you may have found, while doing your homework, that a flowchart is defined as "a diagram that represents an algorithm" and that is certainly correct. But what exactly is an algorithm?

An algorithm is simply a set of step-by-step instructions to complete a process (solve a problem or perform a specific task). The most important rule when creating an algorithm is that it must have a beginning and an end—this is known as finiteness.

So, whether you're creating a guide to prepare coffee or describing the steps to calculate the speed a rocketship needs to escape Earth, the algorithm must always come to an end at some point.

Start/End symbol:

When working with flowcharts, we use a specific symbol to represent the start and end of the process. This symbol is called "Terminator" and it is represented by an oval

  • This oval is placed at the beginning (labeled "Start") and at the end (labeled "End") of the flowchart.
  • Between these two ovals, we will insert the other symbols that represent the steps of our process.


Arrow symbol:
The Arrow symbol is used to indicate the flow (direction) that the flowchart is following. Although flowcharts are typically read from top to bottom, there are times when different paths are created, so it is important to use arrows from the beginning.


Process symbol:
The Process symbol  represents a step in the process. It is shown as a rectangle, and inside it, we write the instruction to be performed. We must ensure that the instruction is clear and precise to avoid any confusion (ambiguity).

You can use as many process symbols as you need, and inside each process symbol, there should be only one instruction. 

*Remember all the symbols must be placed between the start and end ovals.

Let's take a look at the next example:

To see the image in full size right clic on it an then select the option "open image in a new tab".
There you can zoom in the image to read the text.


CLASS ACTIVITY

For today’s activity, you’re going to create two different flowcharts in your notebook to represent two things you do when taking the Technology III class.

First flowchart:

  • Create a flowchart using only the start/end and process symbols to represent the steps a student must follow to enter classroom ( the online educational platform) once the student is sitting at the workstation. Take into consideration that the computer is turned off when the student arrives at the workplace

Second flowchart:

  • Create a flowchart using only the start/end and process symbols to represent the steps a student must follow to go from your workplace to the nearest bathroom in the school. Consider that the classroom door is open and the student has the teacher's permission to go to the bathroom.


Once you finish the two flowcharts, give them to the teacher for review. If the flowcharts are complete, the teacher will sign your activity. If not, the teacher will ask you to complete or correct them.


CLASS NOTES

Write down in your notebook the title of the class, the objective and follow the instructions.

Include in your notes the next questions and answer:

  • What is this flowhcart describing?
  • Do you think the flowchart is missing any steps? If so, write the step or steps that the flowchart is missing.

August 30, 2024

Week 2 - Diagnostic test

CLASS OBJECTIVE

Recognize the level of achievement and learning obtained in the previous course and reinforce the contents required for the following course, through the application of a diagnostic test.


DIAGNOSTIC INSTRUCTIONS

You will receive the instructions for the application of the diagnostic test through Classroom.

When finished, keep the page with your final grade open to review your answers.

http://classroom.google.com


ERP PLATFORM

This week we're going to verify the ERP Web site and the app installation on your phone. In order to do this, you're allowed to take your phone out.

Portal de Aumnos

We can start verifying the ERP account in the next Web address:

http://www.idc.edu.mx/PortalAlumnos

If you don't know or don't remember your password, click on the orange button called "Recuperar contraseƱa" and follow the instructions.


Phone installation

    If you haven't installed the app, open Google Play or App Store an follow the instructions.


 HOMEWORK REVIEW

All notebooks should have printed and pasted the classroom rules and de evaluation criteria.


CLASS ACTIVITY OR HOMEWORK

As you already know, at the beginning of every period we create a cover, just as a separator.

I do not ask for it to be very elaborate but I do require the following elements:

  • Your full name
  • IDEC Student number
  • Subject Name: Technology 3
  • Name of the period we're starting: Period 1
  • Drawing allusive to the topic that we'll see in the course: Computer Programming
  • The class blog adress

This cover will be reviewed the next class, do not send it by Classroom.


August 15, 2024

Week 1 - Course presentation

CLASS OBJECTIVE:

To show the syllabus presentation, the rules and the evaluation criteria for Technology class, to inform the studentes the behavior expected from them and the way they'll be graded during the course.


CLASSROOM LAYOUT

  1. Students can't come into the lab with their backpacks, so they'll leave them in the place indicated by the teacher.
  2. Computers will be assigned to each student and remain off until the teacher indicates.
  3. The attendance list will be verify and correct if neccesary.


IDEC ACCOUNTS
Once again IdeC students will have personal user names and password, we won't have a shared Windows account to turn on the computer anymore. In order to use your private account you'll have to create a safe password, write it down in your daily planner (agenda) and follow the next instructions.
  1. Turn the computer on and wait for Windows to ask for your user name.
  2. Type your student number starting with an A. For example: A12345
  3. Type the next generic password:
  4. The system will ask you to change the password. Type your new password.


GOOGLE ACCOUNT

Students will turn on the computers and open their Google account.

Important informations for new students
  • Teacher will provide the temporary password to open the Google account.
  • This temporary password must be immediately changed to a personal password.

Before continuing, all students must have their personal account open to switch google language to english.


GOOGLE CLASSROOM
Students must open Classroom service to check if all the invitations from their teacher have been accepted.
  • For new students, teacher should make a brief explanation of how Classroom operates.


COURSE PRESENTATION 
  1. Briefly, recall the topics covered in previous courses.
  2. Indicate that the =IF() function from spreadsheets will be taken as a reference to start with the third grade course.
  3. The main topic in third grade will be PROGRAMMING LANGUAGES, to create solutions for simple problems through the use of programming codes. Examples: Raptor, PSeInt, Python, HTML, Scratch, among others.


CLASS BLOG PRESENTATION 
As many know, in this class we use a Blog to give you information and instructions for every topic, so we recommend that you take note of the next web address.


Open the blog because the Internal Rules of the Class and the Evaluation Criteria will be read.


HOMEWORK
Both documents, class rules and evaluation criteria, must be printed and pasted in the first page of Techno's notebook.