November 25, 2024

Week 14 - Lines and flood filling

 CLASS OBJECTIVE

Create a given figure in the graph window by using the Draw_line and the Flood_fill calls, to ensure the understanding of coordinates in the Cartesian plane


INTRODUCTION

It seemed necessary to teach you how to create lines in the graph window and how to fill closed areas with color, like in Paint, before we combine them with loops. Take a look at the next Raptor calls.

draw_line(x1,y1,x2,y2,color)

  • x1,y1 are the coordinates for the starting point of the line
  • x2,y2  are the coordinate for the ending point of the line

For example, in a 500x500 graph windows we can use the draw_line Call like this:

draw_line(100,50,450,350,blue)

and the result should look like:


flood_fill(x1,y1,color)

  • x1,y1 are the coordinates to flood fill the closed areas.
  • Color: Here you have the color list you can use: Black, Blue, Green, Cyan, Red, Magenta, Brown, Light_Gray, Dark_Gray, Light_Blue, Light_Green, Light_Cyan, Light_Red, Light_Magenta, Yellow, White

I'm sure you'll get the point in the next activity


ACTIVITY

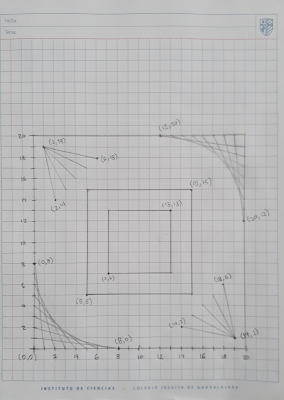
You'll star the activity in a grid sheet of paper. 

  • Draw a box of 10 by 10 squares
  • Every square represent 50 pixels
  • As always, the starting point is the left lower corner.
  • Now, try to determine the coordinates for every point in the next figure.
    • Write down every coordinate either in the plane or beside it.


Now, you will create a program in Raptor to create this figure, using the coordinate you obtained in your grid sheet of paper.
  • Don't forget to use the flood_fill call to apply colors. You'll have to determine a point inside the closed areas using coordinates.
  • Once you finish, turn in the outcome file using the Classroom post.


CLASS NOTES

Write down in your notebook the title of the class, the objective and follow the instructions.

  • Explain the draw_line and the flood fill calls, and their parameters

November 17, 2024

Week 13 - Calls, special functions in Raptor

 CLASS OBJECTIVE

Know the Calls (special functions) in Raptor, to create graphic results such as geometry shapes, by opening a Graph Windows to draw different sizes circles, using loops.


INTRODUCTION

In Raptor we can create graphic results but, in order to do this you must learn how to use the Calls. A Call is a special function, previously programmed, that you can call (which is why the name).

There are plenty of Calls, but today we'll start with a couple of graphic Calls: 

  •  open_graph_window(width, height)
  • draw_circle(x_position, y_position, radius, color, filled)

You can compare Calls with the spreadsheet functions. To use them in Raptor you'll insert the Call symbol, then double click on it and you'll have to type the Call and its parameters.


For example, to open a graph window you would type:  

  • open_graph_window(300,500)
    • where 300 represent the window width 
    • and 500 represen the window height

Once you open a graph window, now you can draw on it, for example a circle:

  • draw_circle(150,250,80,red,0)
    • 150,250 represent the position of the circle´s center
    • 80 is the radius lenght
    • red is obviouly the color
    • 0 will be use to draw an unfilled circle and 1 to draw a filled circle.


ACTIVITY PART 1

Create the next Raptor program and try it.  Use the name Student number + graph window for the file.

  • Change the window size.
  • Change the color using english.
  • Change the circle´s center.
  • As you can see, the circle´s size depends on the user selection. 

Show your teacher the program and continue with the second part.


ACTIVITY PART 2
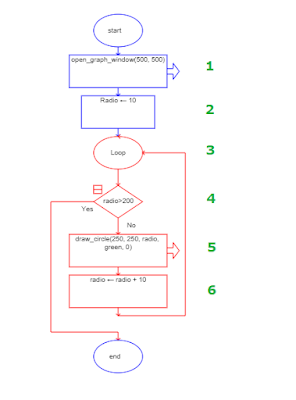
Now you'll change (or restart) the program to draw many circles usin a loop, as we learn in the last class. Use the next image to do it.

Once you finish, turn in the file using the Classroom post and continue with the class notes.


CLASS NOTES

Write down in your notebook the title of the class, the objective and follow the instructions.

  • Draw the last flowchart in your notebook, the one with the Loop. 
  • Describe, in your own words, what is the algorithm doing in every step indicated (numbers 1 to 6)


HOMEWORK

Research, using the Raptor official page (https://raptor.martincarlisle.com/docs/), the next graph drawing operations and tell, in your own words, how do they operate.
  1. OPEN GRAPH WINDOW
  2. DRAW CIRCLE
  3. DRAW LINE
  4. DRAW BOX
  5. FLOOD FILL

November 15, 2024

Week 12 - 2nd Period Cover design

CLASS OBJECTIVE

Kown the Raptor Graphic Window structure by drawing lines and boxes in a Cartesian plane, in the 2nd Period cover.


ACTIVITY

As always, you'll have to create your notebook cover, but this time you're going to use a Cartesian Plane to draw some lines and boxes. This will help you understand our next topic, the Raptor Graphic Window in which we'll use X and Y dimensions (coordinates).

Besides, don't forget to include the next elements. You can use the upper section of your cover.

  • Your full name, list number and group
  • PERIOD 2, in big size letters
  • RAPTOR GRAPHIC WINDOW, also big size letters

Turn the page and, behind the cover, write down the Evaluation Criteria

  • Class Activities  45%
  • Homeworks  15%
  • Attitude   10%
  • Summative Evaluation   30%


Week 11 - Summative Assessment

 CLASS OBJECTIVE

Evaluate the knowledge and skill abilities developed, in this first Period, in the basic use of Raptor Programming Environment